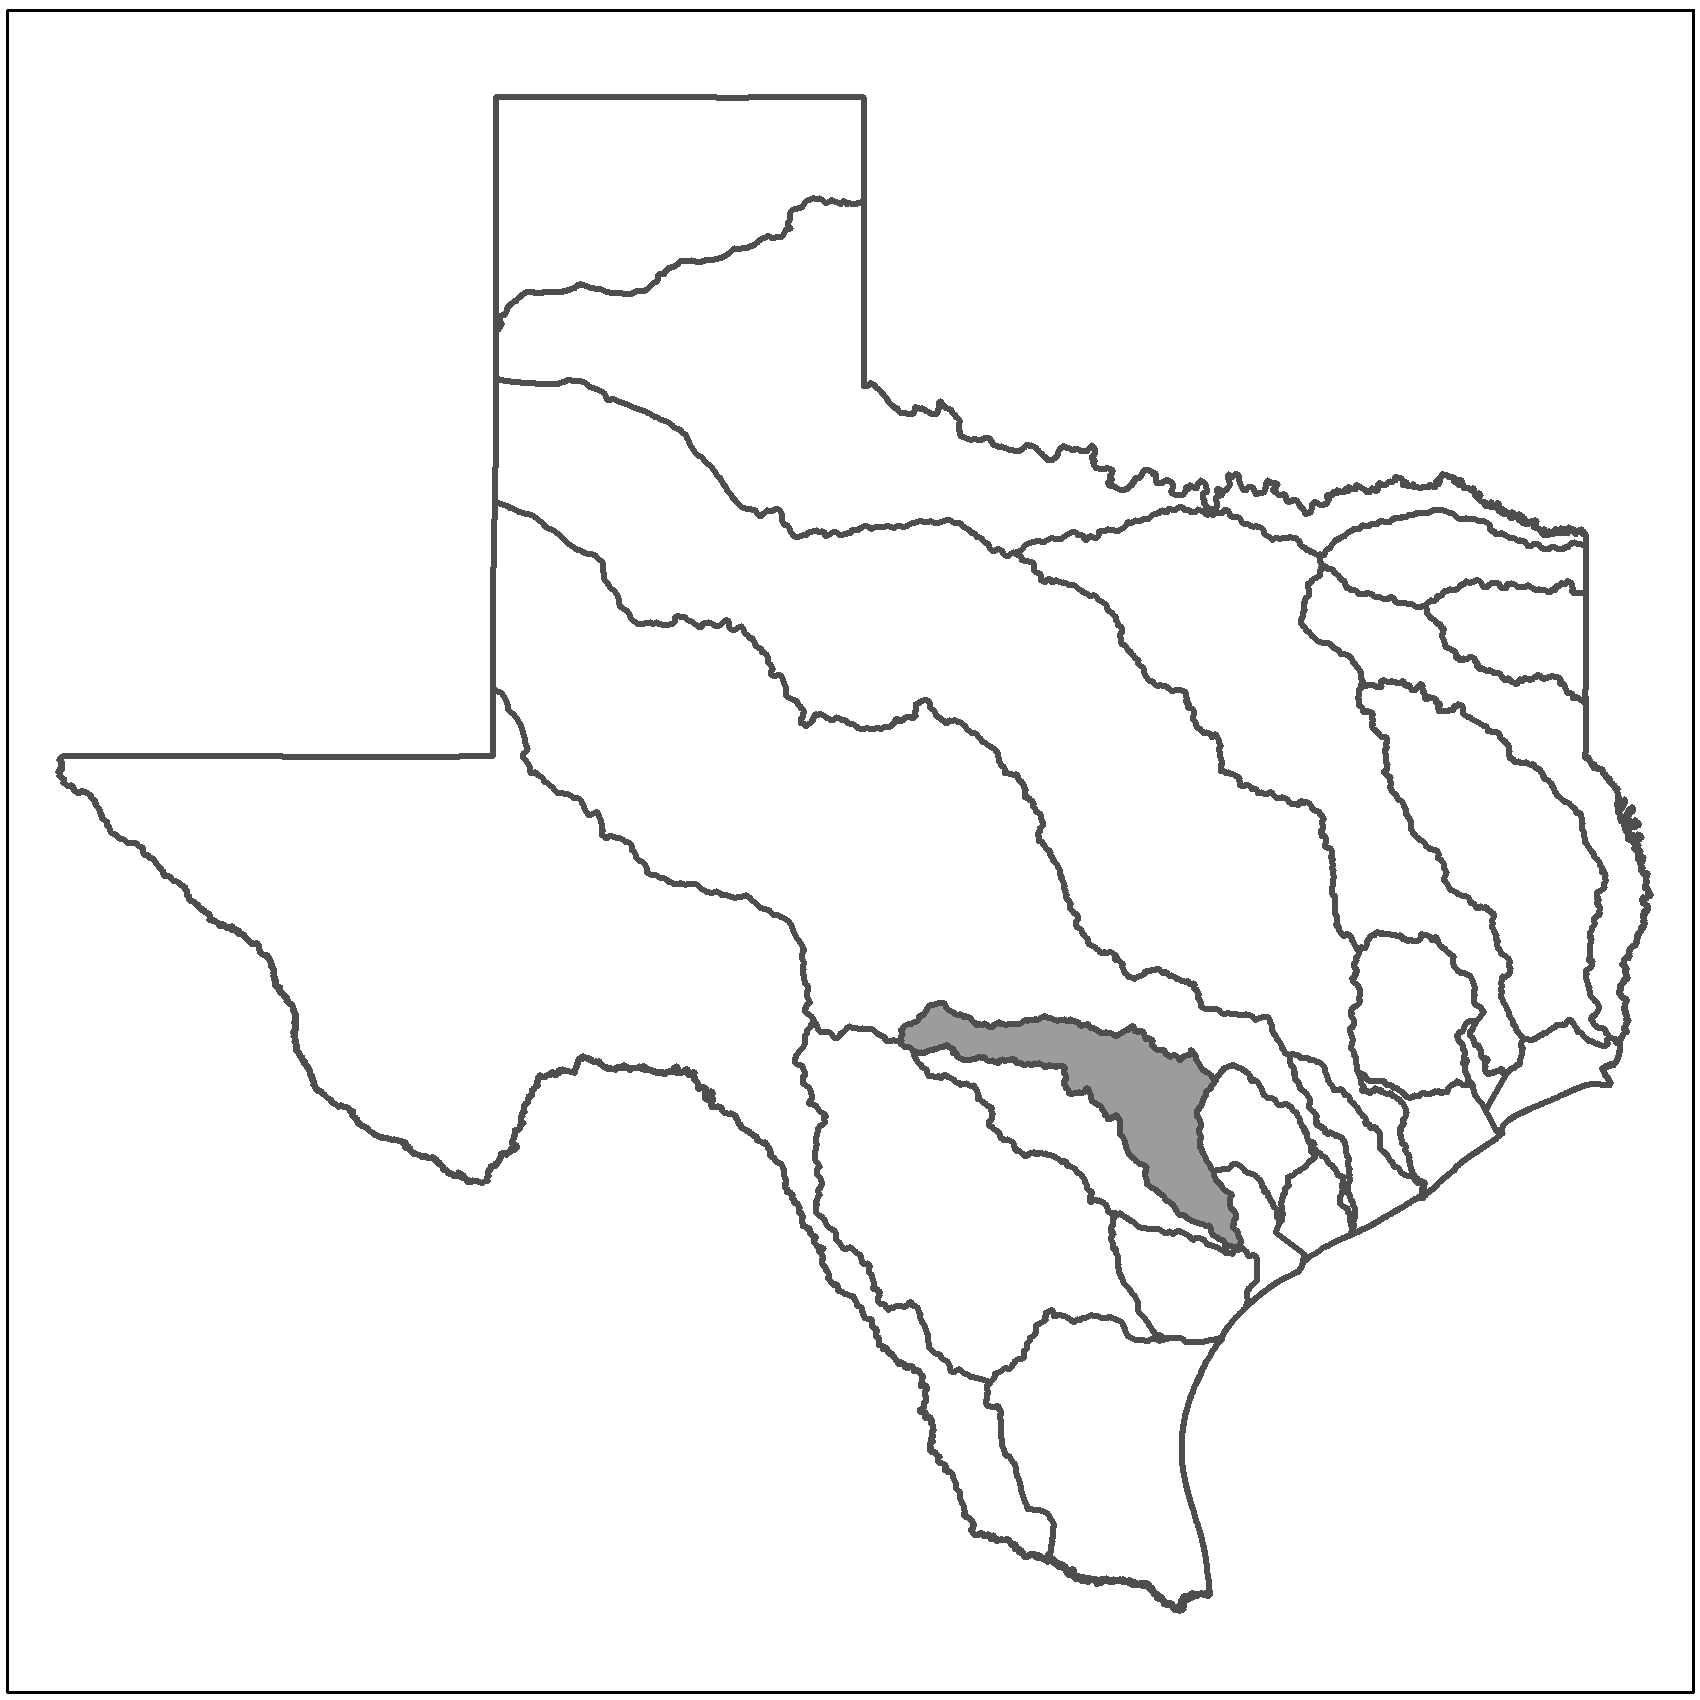
The Guadalupe River Basin boasts some of the most iconic waterscapes of Texas, including Comal and San Marcos springs, the two largest spring systems in the state. The Guadalupe River
and its major tributaries drain from the Hill Country to San Antonio Bay and the Gulf of Mexico. A major challenge within the basin is balancing human needs and new water supply
projects while protecting the endangered species that depend on the Edwards Aquifer and San Antonio Bay. Groundwater development throughout Hill Country also threatens regional surface
water ecosystems.
Major tributaries: Blanco, Comal, and San Marcos Rivers
Major cities: Kerrville, San Marcos, New Braunfels, and Victoria
Reservoirs: Canyon Lake
What does the Texas Water Explorer tell us about the Guadalupe River Basin?
Water Quantity
Modeled River Flow Alteration - Under current levels of water withdrawal, river flows in 0% of the Guadalupe River Basin are regularly depleted by more than 50%; 0% of the basin
is regularly depleted by more than 80%.
Under current levels of water withdrawal, river flows in 2% of the Guadalupe River Basin regularly fall out of the range associated with a presumptive e-flows standard (+/- 20% of
natural flow), with 2% of the basin regularly below the standard and 0% above the standard.
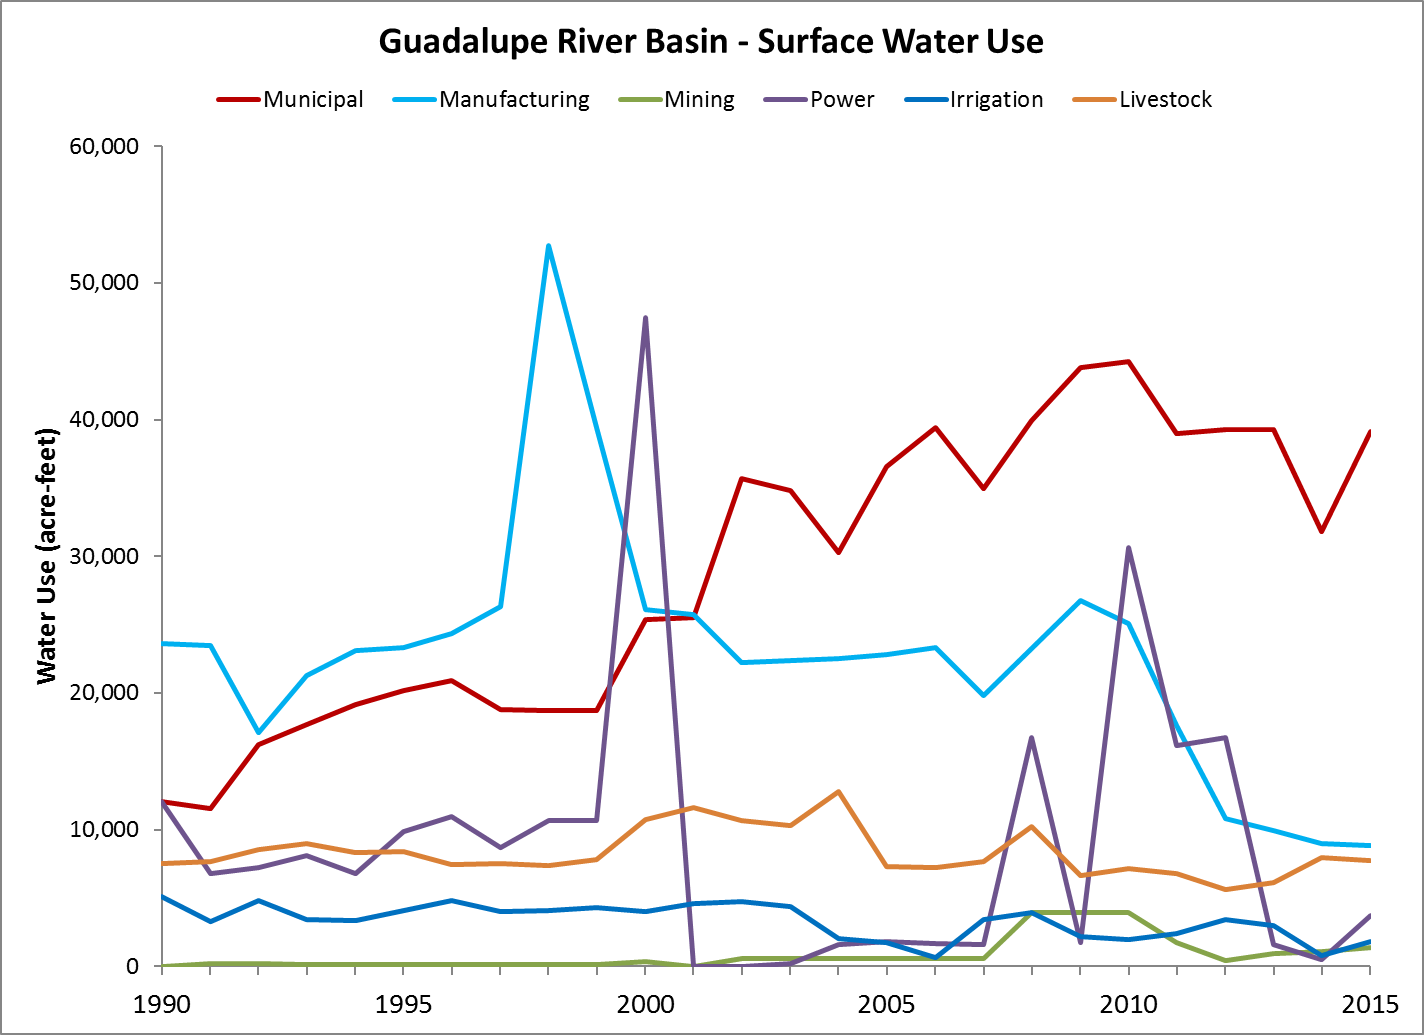
Water Use by Sector - Over the last five years, 49% of Guadalupe River Basin surface water use has been for municipal purposes, with another 22% for manufacturing.
Trends in 7-Day Minimum Flows - 12 of the 15 streamflow gauges analyzed in the Guadalupe River Basin show declining 7-day minimum flows (the lowest flow of 7-day duration for each
calendar year) over the last 20 years. Five gauges show statistically significant declines. One indicates increasing flows.
Trends in Magnitude of Small Floods - Three of 16 streamflow gauges analyzed in the Guadalupe River Basin show declining magnitude of small floods over the last 20 years, none
with a statistically significant decline. Four of the gauges show increasing small flood magnitude, none with a statistically significant increase.
Surface Water Quality Impairments - The Guadalupe River Basin has 1,233 kilometers of water quality assessment segments evaluated by the Texas Commission on Environmental Quality;
32% of these have impaired water quality.
Vulnerability to Ecological Impacts From Land Uses - Of the 1,935 kilometers of rivers and streams in the Guadalupe River Basin, 8% are considered highly vulnerable to ecological
impacts from general land clearing, 4% from impacts of urbanization, and 1% from impacts of row crop agriculture.
Invasive Species Assessment - All four of the sub-basins in the Guadalupe River Basin have at least one invasive aquatic species with potential to significantly harm aquatic
ecosystems, and all four of the sub-basins have at least five species.
Priority Conservation Areas - The Nature Conservancy has defined 13 priority areas for freshwater biodiversity conservation within the Guadalupe River Basin.
River Fragmentation - Of the 1,935 kilometers of rivers and streams in the Guadalupe River Basin, 20% occur in a large river network (at least 2,500 km of stream length) that is
not fragmented by large dams.
1% of the 1,935 kilometers of rivers and streams in the Guadalupe River basin have no downstream dam and are therefore open to the Gulf of Mexico.
Value of Water in the Economy - The basin is comprised of 22 Texas counties; 12 of those produce more than the statewide average of $75,651 in total sales per acre-foot of water
use. 14 have more than the statewide average of 0.68 employees per acre-feet of water used.
Environmental Flow Protection - The environmental flows process initiated by Senate Bill 3 led Texas to adopt nine instream flow standards and one freshwater inflow standard (for
San Antonio Bay) in the Guadalupe River Basin.
Endangered Species Act - 19 of the 22 counties in the Guadalupe River Basin have at least one federally threatened or endangered freshwater species. Water management decisions in
those counties must balance human water needs with endangered species conservation.
Water Quality Management Programs - The Guadalupe River Basin has one river segment with a Total Maximum Daily Load project. Watershed Protection Plans are in place for Cypress
Creek, Geronimo Creek, Plum Creek, and Upper San Marcos. Collectively, these cover 10% of the land area in the basin.
Urban Water Use Efficiency - Average total per capita water use by 10 cities in the Guadalupe River Basin is 159 gallons per capita per day (GPCD), slightly above the statewide
average of 154 GPCD. Average residential water use is 60 GPCD, while the statewide average is 69 GPCD.
The average water loss rate for public water supplies in the Guadalupe River Basin is 14%, while the statewide average is 16%.
Water Efficiency in Electricity Generation - There are four power plants in the Guadalupe River Basin and they average 19.32 withdrawal gallons per kilowatt hour (compared to the
statewide average of 35) and 0.42 consumption gallons per kilowatt hour (compared to the statewide average of 0.36).
Irrigation Demand - Ten of 22 counties in the Guadalupe River Basin use more than the statewide average of 1.66 acre-feet per acre of irrigated cropland.